My usual response is to ask why, and then again ask against what.
Most of the time I do not get an answer as to why. That of course means the person saying it is just repeating the common mantra of the day, just as the shoe shine boy was telling everyone to short the dollar back in March of 2005.
On March 18, 2005 I made the following post on my Global Economic Analysis Blog.

By the time you see covers like that, trends are well established. Where was the warning about the US$ two years ago or even 1 year ago? Indeed, big money is not often made on front page news. Big money is made on page 16 news that is headed to page 1. The Euro was probably on page 16 in 2002. Now look at it. "The Shrinking Dollar" has been on page one of the Wall Street Journal for months and just made the big time with the cover of Newsweek. Is there anyone out there that is not aware of the plight of the US dollar?The dollar rallied to my target of 90 (and then some). Now what? That rally has stalled and immediately everyone is hopping on the short dollar bandwagon again. Is this yet another "sure thing?"
Reasons given why "the dollar is toast"
Following are the four most common reasons cited for the dollar being toast.
- The Balance of Trade
- The National Debt
- The Savings Rate
- Monetary Printing by the Fed
The Balance of Trade
The following chart shows the trade weighted exchange index of major currencies vs. the balance of payments. The US current account balance went negative in 1992 and has stayed there ever since. Trade weighted currencies (a chart nearly identical with the US$ index) show no correlation (that I can see) to the balance of trade. The proper conclusion is that currency trends may have little or nothing to do with trade balances. Note: I am not saying that the trade imbalance does not matter, I am just saying there is little reason to believe that there is going to be any correlation between the two for perhaps long periods of time. The chart below certainly show it is not a tradable event.

The National Debt

The above national debt chart is courtesy of Zfacts
I do not have the ability to superimpose the US$ index over that chart but if I could I am positive I would not find any meaningful correlation. However, if a sudden immediate correlation between National debt as a percent of GDP and currencies were to occur I am confident that dollar bears would not like it too much. For example, please consider Japan.
Ikjeld reported on September 24, 2005 Japan's National Debt Hits New High.
Japan's government debt ballooned to a record high of JPY 795.8 trillion (USD 7 trillion) at the end of June, according to a report released by the Japanese Finance Ministry. It was projected to be JPY 774 trillion for this fiscal year, so the national debt is growing faster than expected.
Japan has relied on government bond issues to make up for falling tax revenues. This has turned the nation into one of the world's most indebted countries. Japan's public debt burden is now almost 160 per cent of its GDP, which makes it the highest in the industrialized world.
Again I do not want to dismiss the problems of the US national debt, but given that Japan's national debt is 160% of GDP and the US national debt is under 70% of GDP, perhaps the US debt still has a ways to go before it matters. Of course one can argue that the US GDP is distorted (it is) and the debt is underreported (it probably is on the basis of future liabilities but then again so is Japan's) but the biggest objection I will probably hear will go something like this: "Japan is a nation of savers" so it does not matter as much. With that let's take a look at savings.
Savings
Following is a chart of the personal savings rate. It has been trending down since 1992 so again I see little correlation to the US$. But let's consider US treasuries for a second. People everywhere point out all of the foreign buying of US treasuries then confidently predict the dollar will collapse along with US treasuries when that support is dropped.
I have long maintained that support will come from US buyers. I am universally laughed at. The big question is "Where is that money going to come from?" But look at the following chart and perhaps you can answer the question yourself. After all where is the savings rate headed from here? Are people going to keep spending more than they are making forever? Are we closer to a top or a bottom on the savings rate. That spike and reversal is many standard deviations away from the norm. It roughly coincides with the blowoff top in the housing bubble. It's dangerous to make cause and effect relationships but for whatever reason there was a clear unprecedented panic out of holding dollars to buying things. I confidently predict a reversion to the mean on this "time preference" away from risk, perhaps even to the point of a panic reversal to the safety of US treasuries. Please note that US treasuries can only be purchased with US dollars.

The following chart shows the US was once a nation of savers. Once the housing bubble collapses, and people see what is happening to their only "savings vehicle" will there be a shift away from consumption toward savings? I think so.

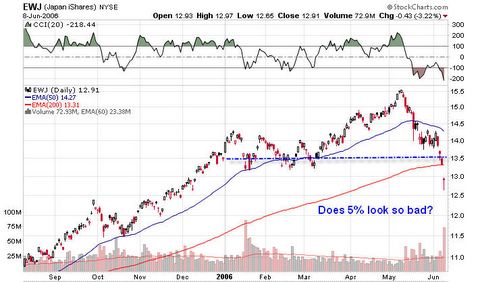
The next hurdle to get over is the CPI. People constantly point out that "the CPI is a joke and you are losing money at 5%". That may or may not be the case (and I have to admit that even I think the CPI is a crock yet I am far from being an inflation alarmist) but what if 5% is the best you can do. Is it better to lose 20% in the stock market (on top of whatever loss in money value there is) or is it better to do the best you can and just take 5% if offered? Let's take a look at that idea.
Does 5% look so bad?

Does 5% look so bad?

Does 5% look so bad?

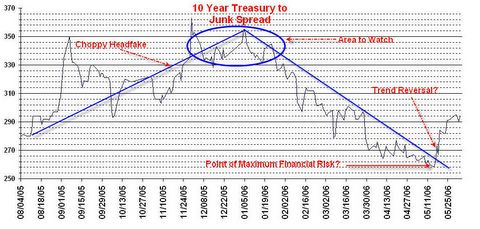
In Point of Maximum Risk I pointed out that one measure of investor's willingness to take on risk is a measure of Treasury spreads to junk.

How much lower can junk spreads get? Corporations have been even going to the junk bond market to raise money for the sole purpose of stock buybacks. Imagine going in debt to buy back shares of stocks after a 3 year equity runup? Does that make any sense (except for insiders selling into those buybacks?). Is there a bubble in bonds? Yes, junk bonds. Is there a bubble in US treasuries? No way.
The Rand

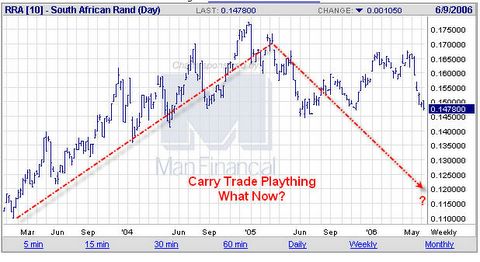
Various currency carry trades are blowing up all over the place. The Rand is one of them and the Icelandic Krona is another one. If there is some sort of "Credit Event" where do you want your money? Let's consider some "flight to safety" alternatives:
- Chinese Renminbi
- Indian Rupees
- Malaysian Ringgits
- Mexican Pesos
- South African Rand
- South Korean Won
- Sri Lankan Rupees
- Thai Baht
- Iceland Krona
- US Treasuries
Monetary printing by the Fed
Make no mistake about it, the Fed has been printing. But it is not just the Fed. More to the point, credit is currently expanding much faster in Europe and China than the US. Monetary expansion in Europe is running at roughly an 8% rate right now (double that of the US) and it is one of the reasons the ECB is hiking.
Europe also has a huge demographic problem (more advanced than the US at this point). Finally, Europe is still struggling with relatively more tariffs than the US and that is hampering its growth. Not too long ago everyone thought the EURO would implode and the EU would break apart. A few short years later (after a huge runup in the EURO) everyone is a Euro bull.
Is the pound the savior? The UK arguably has a bigger pension problem than the US as well as a bigger housing bubble. What about the RMB? I have posted many times on my blog that the RMB would likely crash as oppose to rocket up if it was all of a sudden freely floated. My biggest reason for thinking that was near universal sentiment in favor of the RMB vs. the US dollar. A second reason was massive non performing loans in the Chinese banking system.
In 9th Inning Liquidity I made the case that the RMB was overvalued on account of monetary pumping.
Based on the huge trade surplus with the United States, which stood at $114 bill in 2005, most analysts have concluded that the current rate of exchange of 8.017 yuan to the US dollar is far too high. However, what matters for the currency rate of exchange is the pace of money expansion relative to real economic growth � not the state of the trade account. [I believe we have now proven the irrelevance of trade in previous charts]Let's look at one more factor, trade weighted relationships as presented by Hussman on January 3, 2006.
After falling to negative 1.2% in March 2001 the yearly rate of growth of the [Chinese] central bank balance sheet (monetary pumping) relative to real economic activity climbed to 28.2% in September 2005. In February this year the yearly rate of growth of the relative pumping stood at 22.1%.
In contrast, the yearly rate of growth of the Fed's balance sheet in relation to real economic activity fell from 11.6% in September 2001 to 0.9% in March this year.
Since China's monetary expansion relative to real economic activity has been accelerating whilst in the United States relative pumping has been decelerating, it follows that China's yuan has to depreciate against the US dollar.
As I've noted before, the euro looks about fairly valued given the present constellation of international price levels, interest rates and inflation pressures, but the Japanese Yen and other Asian currencies still appear undervalued relative to the U.S. dollar (of course, this is why despite a certain amount of dollar weakness since 2000, certainly against the euro, we haven't seen much of a decline in the trade-weighted dollar).
In reference to "As I've noted before", let's take a look at what Hussman was saying December 20, 2004 in an article entitled Is the Dollar Really Overvalued?
Over the past couple of years, I've argued strongly and repeatedly that the deep and ongoing U.S. current account deficit will compromise growth in U.S. gross domestic investment for years to come. As the size of the U.S. current account deficit gradually receives more attention, it has become an article of faith that the U.S. dollar is overvalued.Bingo. Hussman nailed it in BOTH directions. Who else did? I recommend clicking on the above links if you are really interested in currency trading. Note that I disagree with him about the RMB for reasons cited earlier, but then again a lot of time has elapsed so his position on the RMB may have changed. Let's now review the reasons for the US$ being toast.
Not so fast.
The basic assumption of the overvalued-dollar thesis is that the current account deficit is simply an import/export problem that will go away if prices (mainly currency valuations) are right. As I've argued before, this misdiagnoses the problem. The U.S. current account deficit is mainly a problem of woefully inadequate U.S. savings. I'll be the first to argue that a revaluation of the Chinese yuan is coming, and that a cheapening of the U.S. dollar relative to Asian currencies will help to �improve� the current account deficit. Unfortunately, this �improvement� will be similar to the improvement in gas mileage that a car gets when it rolls off the side of a cliff into the deep blue sea.
It's important to recognize that the dollar's valuation is neither the cause nor the solution of the U.S. current account deficit. Sure, if you think of a current account deficit as being caused by an overvalued dollar, it's simple enough to think that a future depreciation in the dollar will clear up the deficit. But if you think of the current account deficit as resulting from insufficient savings, then forcing the adjustment burden onto the dollar (rather than adjusting savings behavior and fiscal policy) can lead to a currency crisis.
In September 2000, with the euro worth about $0.85, I published a piece called Valuing Foreign Currencies that describes my approach to estimating currency valuations. Basically, a currency is both a means of payment and a store of value, which means that it has to be priced on the basis of what I call a �joint parity� involving both price levels and interest rates across countries. At the time of that article, I argued that the euro was substantially undervalued.
Since then, the euro has advanced by over 56% against the dollar, to a recent value of $1.33 per euro. [Mish note - remember this was written in Dec of 2004]. From the European standpoint, the U.S. dollar looks cheap (but could get even cheaper). Joint parity looks about $1.13 per euro.
Reasons cited for the dollar being toast:
- The Balance of Trade
- The National Debt
- The Savings Rate
- Monetary Printing by the Fed
Number 4 was at one time but has it already been priced in?

Did not the dollar index correct 33% from top to bottom. Did not various countries currencies nearly double against the US dollar? How much more is left? Is the US$ going to fall in half again from here? Other than possibly gold (and that as of now is meaningless to the masses but not gold bugs), against what currency and why?
Final Thoughts: From Brian and Mish at the Survival Report:
Brian and I think the US dollar may have a ways to fall but arguably the dollar is much closer to the bottom than the top. In contrast to those that think "bonds are in a bubble" We think bonds EXCEPT US Treasuries are in a bubble. The problem is when most people say "bonds are in a bubble", they mean US Treasuries. We believe that that is simply wrong for reasons outlined above, and we are bullish on Treasuries.
As to the US dollar and gold, neither of us is really a dollar bull or gold bear, but rather we are somewhat agnostic towards the dollar yet long term bullish on both gold and energies (but not right now as various carry trades unwind). Besides, gold has disconnected from the US dollar. What's to worry, right? Yet, the unwinding of excess liquidity, a shift in time preference away from risk to increased savings, and a looming "flight to safety" panic explains why we are and have been short various markets and long US treasuries.
Perhaps one day gold will not correct, but this correction was true to form. When gold was over $700 our call of a fall to $600 or below seemed unlikely to most. Yet we are now within spitting distance. Our experience is that hyperbolic moon shots always correct more than anyone thinks. Nibbling on gold miners here may not hurt from a long term perspective (and for gold bugs is perhaps advisable) but seasonality and market action are still unfavorable. Overhead resistance is also substantial. If time preferences away from current consumption and excessive risk have made a permanent change (a belief we find likely), things could get very ugly across many fronts but especially equity and junk bond funds.
Mish Addendum: I started writing the above on June 8th and 9th for a special report on the dollar for the Survival Report. The stock market charts above reflect that and as such are dated by the time you are reading this. Note too that gold dipped well below our retracement target of $580. On weekly/monthly charts gold could fall to the $480-$500 level and still have the major uptrend intact. It may or may not get there but if it does, it could be the last chance train. Gold seems to like to shake out as many people as possible. A round trip to $480 could do just that.
Mike Shedlock / Mish
http://globaleconomicanalysis.blogspot.com/
0 comments:
Post a Comment