I recently came across a press release from Revenue Science claiming that they now reach 1 Billion behaviors per day. http://www.revenuescience.com/site/media/press-releases/2006/20061107.asp. So what is this all about? In my opinion Behavioral Targeting (or any kind of targeting) is about reaching users/visitors /customers not behaviors.
Anyway, even if they are reporting their reach in terms of numbers of behaviors, then how are they counting behaviors? The way I think of behaviors, Revenue Science is underreporting reporting the number of behaviors they reach everyday, it has to be way more than 1 Billion. Let me show you how a single visitor can exhibit over a Billion behaviors.
What is an online behavior?
Every single action that a user takes on the site determines user�s behavior. Following are some of the different elements that determine the behaviors of users online
1. Every page view
2. Number of minutes on a page
3. Path taken
4. Links/Ads clicked
5. Scrolling on the page
6. Referring Sites
7. Each second in the visit
8. Each visit
9. Total Visits
10. Total Page views
11. each Product viewed
12. Each cart abandoned
13. Each step of the funnel completed/abandoned
and the list goes on�...
Let�s take a site with 30 pages. A single user visits all 30 pages. So how many behaviors has this user exhibited? According to my calculation, way over 1 Billion.
How do you calculate online behaviors? (I am only going to count pages viewed to count behaviors)
Each page view by itself is a unique behavior; so this user has exhibited 30 behaviors by viewing all 30 pages.
Combination of pages 1 and 2 is a unique behavior too, that is one more behavior, so total is now 31.
Every combination of these 30 pages will be a unique behavior exhibited by this user.
So how many combinations of 30 pages exist? I am not going to go into details of calculus but show you the formulas here
nCk = The number of combinations of n things taken k at a time
The sum of all the combinations of n distinct things is 2n.
nC0 + nC1 + nC2 + . . . + nCn = 2n
We won�t count any combination with 0 page views (i.e. the user never showed up on the site) so in our example above
nC1 + nC2 + . . . + nCn = 2n - nC0
i.e.nC1 + nC2 + . . . + nCn = 2n - 1
So, combinations of 30 different page views (behaviors) = 230 - 1
That comes to 1, 073, 741, 823 Behaviors. That comes to 1, 073, 741, 823 Behaviors. (http://www.google.com/search?hl=en&lr=&q=2**30+-1&btnG=Search)
Yes over a billion behaviors exhibited by 1 user viewing 30 pages.
If I take various other elements that define behavior (see above) than you don�t even need 30 pages to reach 1 Billion behaviors.
Conclusion
Behaviors motivate but people read your content and buy your products. In my opinion, it is not about how many behaviors a BT vendor can reach, it is about how many customers they can reach.
Sunday, November 19, 2006

October Housing Starts, Permits, Foreclosures
Was it just last month that Greenspan and David Lereah at the National Association of Realtors were declaring a bottom in housing?
That myth was shattered on November 17th when the Census Bureau released the Residential Construction Report for October 2006.
Building Permits
New Home Sales
Lereah was crowing about new home sales back on October 26 when Commerce Department reports showed �New-home sales in the U.S. unexpectedly rose for a second month in September as selling prices declined by the most since 1970. Purchases increased 5.3 percent to an annual pace of 1.075 million during the month from a 1.021 million rate in August. The median price of a new home dropped 9.7 percent from a year earlier, partly a result of more sales of homes priced less than $200,000 and fewer purchases of more expensive houses. �
New home sales may have risen in theory but in actual practice it is likely that sales declined considerably. The reason is that cancellations are not reflected in new home sales stats and cancellations have been soaring.
Cancellations
Lereah was not the only bottom caller in housing. When the the National Association of Home Builders/Wells Fargo Housing Market Index (HMI) "exploded" by three points from 30 to 33 in the last two months, NAHB spokesmen offered these comments just one day prior to the release of the disastrous October housing starts data.
What the NAHB did not say was that the HMI is a diffusion index and that readings under 50 show contraction. Is a move from 30 to 33 statistically relevant?
Kevin Depew on Minyanville answered that question way back on October 18th when at that time the HMI index exploded up by one full point. Please consider the following charts.


Thanks Kevin & Minyanville!
Foreclosures
RealtyTrac is reporting Foreclosures surpass 1 million mark in October.
Housing Starts vs. Employment
The overall housing picture looks grim but is even worse than it looks, especially from an employment point of view. The following chart is courtesy of CalculatedRisk. It shows residential construction employment vs. housing starts offset by six months.

Click on the chart for an easier to read view.
Thanks CalculatedRisk!
The chart above shows that although starts have plunged, completions remain high. This has ominous implications for construction jobs looking ahead. Given that employment will follow housing starts with a lag as existing construction completes, it appears that a minimum of 600,000 construction jobs will be lost over the next six months or so.
The ripple effect of the loss of those jobs, especially on consumer spending will be very noticeable. If anything, this may be a best case scenario on the unlikely assumption that starts and permits do not decline further. Note too that with the expected decline in consumer spending as a result of housing sector weakness, layoffs will likely cascade to a wide variety of other jobs especially restaurants and retail sales jobs.
It remains to be seen if consumer spending ticks back up this Christmas season (I doubt it) but if it happens it will be the consumer�s last hurrah. A recession in 2007 is now all but guaranteed.
Mike Shedlock / Mish
http://globaleconomicanalysis.blogspot.com/
That myth was shattered on November 17th when the Census Bureau released the Residential Construction Report for October 2006.
Building Permits
- Building permits fell 6.3 percent to a seasonally adjusted annual rate of 1,535,000.
- Building permits fell 28.0 percent from the October 2005 rate of 2,131,000.
- Single-family authorizations in October were at a rate of 1,173,000. This is 3.8 percent below the September figure of 1,219,000.
- Housing starts fell 14.6 percent to a seasonally adjusted annual rate of 1,486,000.
- Housing starts fell 27.4 percent from the October 2005 rate of 2,046,000.
- Single family housing starts in October were at a rate of 1,177,000. This is 15.9 percent below the September figure of 1,400,000.
New Home Sales
Lereah was crowing about new home sales back on October 26 when Commerce Department reports showed �New-home sales in the U.S. unexpectedly rose for a second month in September as selling prices declined by the most since 1970. Purchases increased 5.3 percent to an annual pace of 1.075 million during the month from a 1.021 million rate in August. The median price of a new home dropped 9.7 percent from a year earlier, partly a result of more sales of homes priced less than $200,000 and fewer purchases of more expensive houses. �
New home sales may have risen in theory but in actual practice it is likely that sales declined considerably. The reason is that cancellations are not reflected in new home sales stats and cancellations have been soaring.
Cancellations
- D.R. Horton (DHI) reported a cancellation rate of 40%, compared with 29% a year ago.
- Meritage Homes (MTH) reported a 37% cancellation rate, compared with 21% a year ago.
- Standard Pacific (SPF) reported a 50% cancellation rate compared with 18% a year ago.
- The overall average cancellation rate for big builders was at 40%, about twice as high as last year's levels, according to the WSJ.
Lereah was not the only bottom caller in housing. When the the National Association of Home Builders/Wells Fargo Housing Market Index (HMI) "exploded" by three points from 30 to 33 in the last two months, NAHB spokesmen offered these comments just one day prior to the release of the disastrous October housing starts data.
�More and more builders are seeing light at the end of the tunnel,� said NAHB President David Pressly, a home builder from Statesville, N.C. �Our members are telling us that the market is steadying after a significant downward correction. On the demand side, we look for sales to stabilize and gradually move up in the coming months.�HMI Charts
�With home prices leveling off, mortgage interest rates remaining near historic lows, energy prices declining and the economy continuing to generate solid growth in employment and household income, affordability is now on the mend and many consumers recognize that home buying conditions have improved,� said NAHB Chief Economist David Seiders. �Builders are picking up on this change in market momentum.�
What the NAHB did not say was that the HMI is a diffusion index and that readings under 50 show contraction. Is a move from 30 to 33 statistically relevant?
Kevin Depew on Minyanville answered that question way back on October 18th when at that time the HMI index exploded up by one full point. Please consider the following charts.


Thanks Kevin & Minyanville!
Foreclosures
RealtyTrac is reporting Foreclosures surpass 1 million mark in October.
�So far this year more than 1 million properties have entered some stage of foreclosure nationwide, up 27 percent from the same time last year,� said James J. Saccacio, chief executive officer of RealtyTrac.Foreclosures are actually close to historic lows, but the rate of change is ominous. Some of the bubble states like California are just now seeing an uptick because year over year home price appreciation was such that anyone having trouble making payments could escape simply by selling their home for a profit. With home prices no declining, mortgage rates resetting, and more home owners underwater that trend is about to change big time.
�Monthly foreclosure filings were just below their high for the year, mirroring the trend from last year, when the most foreclosures of the year were also reported in October. Our data from the last three months shows that foreclosures are definitely trending upward, putting more pressure on an already strained housing market, and placing buyers and investors in the driver�s seat when it comes to negotiating home purchases.�
Housing Starts vs. Employment
The overall housing picture looks grim but is even worse than it looks, especially from an employment point of view. The following chart is courtesy of CalculatedRisk. It shows residential construction employment vs. housing starts offset by six months.
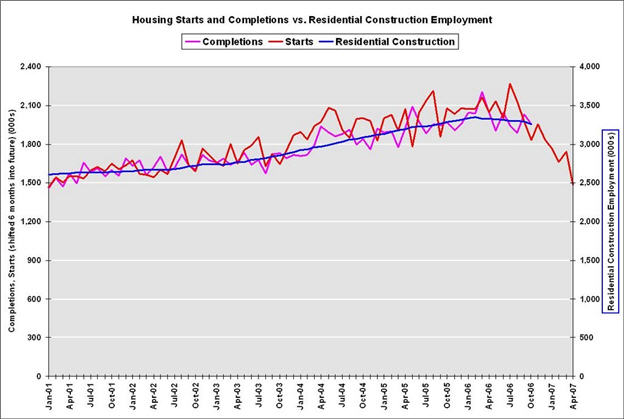
Click on the chart for an easier to read view.
Thanks CalculatedRisk!
The chart above shows that although starts have plunged, completions remain high. This has ominous implications for construction jobs looking ahead. Given that employment will follow housing starts with a lag as existing construction completes, it appears that a minimum of 600,000 construction jobs will be lost over the next six months or so.
The ripple effect of the loss of those jobs, especially on consumer spending will be very noticeable. If anything, this may be a best case scenario on the unlikely assumption that starts and permits do not decline further. Note too that with the expected decline in consumer spending as a result of housing sector weakness, layoffs will likely cascade to a wide variety of other jobs especially restaurants and retail sales jobs.
It remains to be seen if consumer spending ticks back up this Christmas season (I doubt it) but if it happens it will be the consumer�s last hurrah. A recession in 2007 is now all but guaranteed.
Mike Shedlock / Mish
http://globaleconomicanalysis.blogspot.com/
Friday, November 17, 2006
Canon PowerShot SD430

Canon takes a step into the future with the SD430's innovative, integrated wireless technology. Transferring photos is even easier. The built in Wi-FI technology allows you to transfer photos to your computer... read more
Specifications
* 5.3 megapixels
* 3x optical zoom / 4x digital zoom
* 2 inch LCD
* JPEG file format
* TTL autofocus
* manual and auto exposure
* ISO 50-400
* Wi-Fi connectivity
* lithium ion battery
* movie mode with sound
Red Tag Madness
Reuters is reporting California auto sales seen slowing through 2007.
GM has been trying to shy away from incentives, but it appears that rising inventories have forced GM's hand. The Detroit Free Press is reporting GM to launch clearance incentives.
GM might not be commenting but a GM dealer on the Motley FOOL who posts under the name JediKnight is. This is what Jedi has to say:
Once again GM is turning to the only method it knows to reduce inventories and move cars, and that of course is incentives.
The economy is clearly slowing and if there was any doubts then the October housing start numbers should put an end to that doubt. Look for incentives of all kinds to dramatically increase from both GM and Ford in 2007 as the consumer led recession of 2007 kicks in full force.
Mike Shedlock / Mish
http://globaleconomicanalysis.blogspot.com/
Auto sales in California, the largest U.S. market for cars and trucks, will slow for the rest of this year and next, a forecast released on Thursday by the state's auto dealers association said. The report commissioned by the California Motor Car Dealers association forecast a 2.5 percent decline in 2007 sales.In PPI, Gold, and Dr. Copper I noted the following auto sector highlights.
"The reasons for the sliding market are plentiful, including slower economic growth, rising interest rates, elevated consumer debt levels and the slowdown in the housing market," the report prepared by consultancy Auto Outlook said. The California market is seen as a bellwether for national auto sales, which were down about 3 percent over the first 10 months of this year from the same period a year earlier.
In one standout trend, the California data showed the shift away from Detroit-based automakers and toward Toyota Motor Corp. has been more pronounced in the state than in the national market this year. Toyota's U.S. sales are up 12 percent so far this year, taking the Japanese automaker's share of the overall light vehicle market to 15.2 percent from 12.2 percent a year ago.
But in California, the most populous and wealthiest U.S. state, Toyota gained 3.7 percentage points of market share through the first three quarters, the study said.
By contrast, the traditional Big Three lost 4.7 market share points in California, the study said. On a combined basis, the Detroit automakers represented just 41.2 percent of auto sales in California through the first nine months, well below their 54.1 percent share nationally.
Prices for light motor trucks fell 9.7 percent following a 3.5-percent gain in September. For 12 months ending October 2006 the index for light motor trucks fell 12.4%Red Tag Event
Passenger car prices fell 2.3 percent in October compared with a 2.8-percent advance in September. For 12 months ending October 2006, the index for passenger cars decreased 3.2 percent.
GM has been trying to shy away from incentives, but it appears that rising inventories have forced GM's hand. The Detroit Free Press is reporting GM to launch clearance incentives.
General Motors Corp. will begin an incentive program this weekend to help clear inventories of 2006 models, three dealers told Bloomberg News.Dealer Comments
The �Red Tag� event might cut prices on many �06 GM vehicles and runs Nov. 18-Jan. 2, Manpreet Wadan sales manager of Bill Pierre Chevrolet in Seattle, told Bloomberg. GM will also allow dealers to discount many 2007 vehicles by $500 or more, he said.
Wadan said the Corvette, Pontiac Solstice, GMC Sierra pickup, Saturn Sky and all Hummer, Cadillac and Saab models.
Phil Vilar, a sales manager for San Diego-based Seaside Buick Pontiac GMC, told Bloomberg some of the details haven�t been decided, such as the full range of models and the distribution of discounts.
John McDonald, a GM spokesman, declined to comment on the incentives.
GM might not be commenting but a GM dealer on the Motley FOOL who posts under the name JediKnight is. This is what Jedi has to say:
In case any board members or lurkers are going to buy a GM car between now and Jan 2...Thanks Jedi!
As part of the "Red Tag" sale, GM has given each dealer an allotment of "coupons", size of allotment is based on the size of dealer's inventory. The dealer has the option of using anywhere from $250, up to $2,000 per unit and it's NOT a rebate, it's dealer-cash meaning he doesn't have to tell you about it.
Yes, coupons are limited so if a dealer tells you that your particular unit of choice "doesn't" qualify for the money, he may be telling the truth. By tonight, all dealers must PRE-DETERMINE which specific units to use how much money on.
It's ridiculous. So if I 'roll the dice' and put $2000 on say, a 2007 white Denali and quote you a price, but now you want the black one ... I gotta raise my price to you. Isn't that pleasant for both sides?
I'm passing this along so that IF you go to your local dealer, you know about it.
Sure you'll know dealer cost, etc via your research, but ask the dealer to "show you which units he put the red-tag cash on ... he has a list WITH VIN numbers".
Mostly dealers will use them towards remaining 06's but you never know.
Asking this question could save you anywhere from $250 to $2000.
Once again GM is turning to the only method it knows to reduce inventories and move cars, and that of course is incentives.
The economy is clearly slowing and if there was any doubts then the October housing start numbers should put an end to that doubt. Look for incentives of all kinds to dramatically increase from both GM and Ford in 2007 as the consumer led recession of 2007 kicks in full force.
Mike Shedlock / Mish
http://globaleconomicanalysis.blogspot.com/
Thursday, November 16, 2006
Heading South
For studio our class is heading to Ecuador, spending a little over a week in Quito, the Oriente and some places in between.

Macas - Militares by RoggenKINO
Posts will resume upon return.
Macas - Militares by RoggenKINO
Posts will resume upon return.
Wednesday, November 15, 2006
Lies, Deceit, Greed
I have been listening to the spin by NAR spokesman David Lereah. The contradictions are nothing sort of amazing.
In Looking for a Bottom on November 11th the Chicago Tribune quoted Lereah as saying:
1) "We need a price decline, we were overbloated"
2) "In 2007, it will be a flat year, maybe 1 percent [sales] drop, and that's it," "After 2007, we'll be back to expansion again."
Which is it, #1 or # 2? Or are we supposed to believe a 1% drop cures overbloatedness? Even if anyone was stupid enough to believe that a 1% drop cured overbloatedness exactly why wouldn't the promised expansion put us right back into overbloated territory again?
On November 13th in Realtors lament prices Lereah moans that home prices are too high.
1) "It's affordability � it's not just mortgage rates that make homes affordable, it's prices. I hope that as affordability starts to improve we see more first-time buyers again," Mr. Lereah said
Back on September 25th in U.S. Existing Home Sales Fall 0.5% in August Lereah said.
2) "We've been anticipating a price correction and now it's here. The price drop has stopped the bleeding for housing sales. We think the housing market has now hit bottom."
Once again is it #1 or is it #2?
If houses are not affordable then how have they hit bottom?
If housing has hit bottom then why do we need a decline to cure overbloating?
Inquiring minds may be wondering exactly what is in the punch that would cause 30,000 people to show up for a NAR annual meeting and listen to such nonsense. When did he call for that price correction anyway, and what evidence is there that the bleeding has stopped?
$40 Million Ad Blitz
Even though housing has bottomed a NAR ad blitz touts the housing market.
The theme of the ad campaign is
1) It's a great time to buy a home
2) It's a great time to sell a home
For the third time today I am asking is it #1 or is it #2?
Carrol Loyd in Don't Delay! Buy Or Sell Now! Right? writes:
NAHB Infomercials
Not to be outdone by the NAR, the National Association of Home Builders is making a package of "It's a Great Time to Buy" ready-to-use ads available to its members for free. Resources in the buy-now package include:
Greed
The GlobeAndMail is reporting KB Homes CEO quits in stock option scandal.
PrudentBear had this comment:
Notes and Addendum.
The above originally appeared in Whiskey&Gunpowder on November 14.
Perhaps straight from the "Sample op-eds, letter to the editor and newspaper columns" from the NAHB "buy-now package" we see the following advertisement from a homebuilder presented as an opinion in the Asbury Park Press on November 15th:
Home buying a good investment in "down" cycle.
Mike Shedlock / Mish
http://globaleconomicanalysis.blogspot.com/
In Looking for a Bottom on November 11th the Chicago Tribune quoted Lereah as saying:
1) "We need a price decline, we were overbloated"
2) "In 2007, it will be a flat year, maybe 1 percent [sales] drop, and that's it," "After 2007, we'll be back to expansion again."
Which is it, #1 or # 2? Or are we supposed to believe a 1% drop cures overbloatedness? Even if anyone was stupid enough to believe that a 1% drop cured overbloatedness exactly why wouldn't the promised expansion put us right back into overbloated territory again?
On November 13th in Realtors lament prices Lereah moans that home prices are too high.
1) "It's affordability � it's not just mortgage rates that make homes affordable, it's prices. I hope that as affordability starts to improve we see more first-time buyers again," Mr. Lereah said
Back on September 25th in U.S. Existing Home Sales Fall 0.5% in August Lereah said.
2) "We've been anticipating a price correction and now it's here. The price drop has stopped the bleeding for housing sales. We think the housing market has now hit bottom."
Once again is it #1 or is it #2?
If houses are not affordable then how have they hit bottom?
If housing has hit bottom then why do we need a decline to cure overbloating?
Inquiring minds may be wondering exactly what is in the punch that would cause 30,000 people to show up for a NAR annual meeting and listen to such nonsense. When did he call for that price correction anyway, and what evidence is there that the bleeding has stopped?
$40 Million Ad Blitz
Even though housing has bottomed a NAR ad blitz touts the housing market.
The National Association of Realtors is spending $40 million on full-page ads in the nation's biggest newspapers, including the Los Angeles Times, to convince people the market is A-OK.If that ad proved anything it is the NAR is in a panic state and that housing has NOT bottomed. It was clearly a waste of $40 million dollars.
"Don't delay," the ad says, urging readers to call Realtors, which represents 1.3 million brokers and agents.
The theme of the ad campaign is
1) It's a great time to buy a home
2) It's a great time to sell a home
For the third time today I am asking is it #1 or is it #2?
Carrol Loyd in Don't Delay! Buy Or Sell Now! Right? writes:
This ad campaign seemed to come straight from the Mad Hatter's tea party.To answer Carol's questions: It' can't be good time to both buy and sell. As for the second question, given that one has to put up considerable margin to buy stocks but one can buy a home with 0% down it's hard to say exactly what it's like. For members of the NAR however, "It's [always] a great time to generate a commission."
How can it be a good time both to buy and to sell? Isn't that like saying it's a good time both to buy Microsoft and to sell Microsoft?
NAHB Infomercials
Not to be outdone by the NAR, the National Association of Home Builders is making a package of "It's a Great Time to Buy" ready-to-use ads available to its members for free. Resources in the buy-now package include:
- Talking points, Q&As and a sample press release
- Sample op-eds, letter to the editor and newspaper columns
- An economic backgrounder
- Print and radio advertisements
- Public relations advice on getting the message out through the media, events and Web sites
- A home builders association guide on how to make the most of the package
- Sample member communications, including a newsletter article and tips for engaging members in the campaign
Greed
The GlobeAndMail is reporting KB Homes CEO quits in stock option scandal.
Bruce Karatz, chairman and CEO of KB Homes, agreed to retire Sunday and repay the Los Angeles-based company $13-million (U.S.) after an internal report concluded the home construction company incorrectly reported stock option grants.Wasn't $100-125 million enough for you Mr. Karatz?
The company also announced the firing of Gary A. Ray, head of human resources, and the resignation of Richard B. Hirst, executive vice president and chief legal officer.
The KB review found the company used incorrect measurement dates for financial reporting purposes for yearly stock option grants from 1998 to 2005, the company said in a statement. As a result of the errors, KB expects a non-cash compensation expense of no more than $50-million. It said the errors may also require an increased tax provision.
Mr. Karatz was one of the highest-paid executives in 2005, making $155.9-million, mostly from exercising options, according to the Wall Street Journal. He had served as KB's CEO since 1986.
"I am extremely proud of everything that the entire KB team and I have accomplished over the past 20-plus years," Mr. Karatz said in a statement.
PrudentBear had this comment:
"Since 1992, he has reaped nearly $180 million from exercising options. Last year, he made more than $150 million from salary, bonus, restricted stock grants and options exercises. The options exercises accounted for the bulk of his pay. The backdating appears to have begun in 1998, when Mr. Karatz received more than 450,000 options. That year also apparently marked a shift to much larger options awards � in each of several previous years, Mr. Karatz had received 100,000 options or fewer. His grants between 1998 and 2001 appeared particularly well-timed. In that period, he recorded one grant dated the day the stock touched its lowest closing price of the year, another at a quarterly low, and two more at monthly lows. One grant of 450,000 shares carried the date of Oct. 25, 1999, and an exercise price of $17.75, the year's lowest close."Now, that's a track record to be proud of for sure.
Notes and Addendum.
The above originally appeared in Whiskey&Gunpowder on November 14.
Perhaps straight from the "Sample op-eds, letter to the editor and newspaper columns" from the NAHB "buy-now package" we see the following advertisement from a homebuilder presented as an opinion in the Asbury Park Press on November 15th:
Home buying a good investment in "down" cycle.
BY MARC J. SIEGELMuch of what Siegel presents in regards to lending practices, credit guidelines, and spec building is easily refuted. Of course cancellation rates were not mentioned at all. Such writings do not belong on the opinion page but under the classified ad section.
The homebuilders of New Jersey are still building and selling homes. The housing industry always has and continues to drive the local and state economy. Despite alarming reports of a "doom and gloom" market, real estate remains a solid, historically proven investment.
Contrary to what you have read, buying a new home is not a risky business. Since the national Savings and Loan crisis in the late 1980s, when banks failed as a result of overextended construction lending, a number of safeguards between builders and lending institutions have been established. These stringent regulations require banks to have sufficient net assets to protect themselves in the event of losses. Moreover, banks are exercising more fiscal caution and have established tighter credit guidelines.
In the 1980s, financial institutions were much more lenient in providing funding for "spec" houses under construction, but not yet sold. Today, residential builders may get financing only for the homes that are already under a sales contract and, thus, do not put themselves in a position of overextending financially with unsold inventory.
....
....
Not only can homebuyers remain confident about purchasing a newly constructed home, it's a buyer's market. There is no better time to buy a home than today. Prices are lower, interest rates are favorable and holding, and builders are more competitive.
....
Marc J. Siegel is president of the Shore Builders Association of Central New Jersey, Lakewood.
Mike Shedlock / Mish
http://globaleconomicanalysis.blogspot.com/
Tuesday, November 14, 2006
Coroflot Salary Results
Back in September I posted about Coroflot's 2006 Design Salary Survey, a survey that is now complete. Almost 250 respondents fell into the architecture category (not nearly as many as the industrial design field but much more than fashion), an amount that gives a good indication of salary relative to firm type but not enough for decent geographical indicators.

Click for larger view
The graph above compares the salaries in the various fields of the survey in terms of staff level, from entry to director. Architecture is highlighted with the red box; the others are (L-R) graphic design, industrial design, interaction/web design, interior design, and fashion design. Even at the small, illegible size above, a few things are clear.
Check Coroflot for more illuminating stats, including Rock-osity.

Click for larger view
The graph above compares the salaries in the various fields of the survey in terms of staff level, from entry to director. Architecture is highlighted with the red box; the others are (L-R) graphic design, industrial design, interaction/web design, interior design, and fashion design. Even at the small, illegible size above, a few things are clear.
:: At the entry level, salaries across the fields are pretty much the same, except for graphic design.This says to me what architects have known for a long time: architects are underpaid. It also appears to indicate that the monetary reward of being partner in a firm is not commensurate with the responsibility, compared to the other fields. For architects the greatest growth is for senior designers, where three out of five of the other fields have that growth happen at the highest level.
:: At the upper level, architects are very low, a little bit higher than the apparetnly poor graphic designers.
:: Salaries for directors (pink bar at top) is not much higher than senior designers (green bar below).
Check Coroflot for more illuminating stats, including Rock-osity.
Subscribe to:
Posts (Atom)


